An EC Labor measurement guide with manufacturer references and our own calculated example.
Why can the surface potential differ from the measured value?
Current passing through resistance produces a voltage drop. In electrochemical measurements, the electrode-surface potential can therefore differ from the value monitored by the instrument. This contribution can distort voltammograms and parameters extracted from them. Interpreting compensation requires a defined resistance and current-sign convention. BioLogic AN27: effects of ohmic drop.
Here positive current is anodic, and the simple series model uses Esurface = Emeasured − iRᵤ. Rᵤ denotes the uncompensated resistance being corrected. For a different exported signal definition, check the sign convention first; substituting absolute current can give the wrong result.
Original example: a 40 mV difference
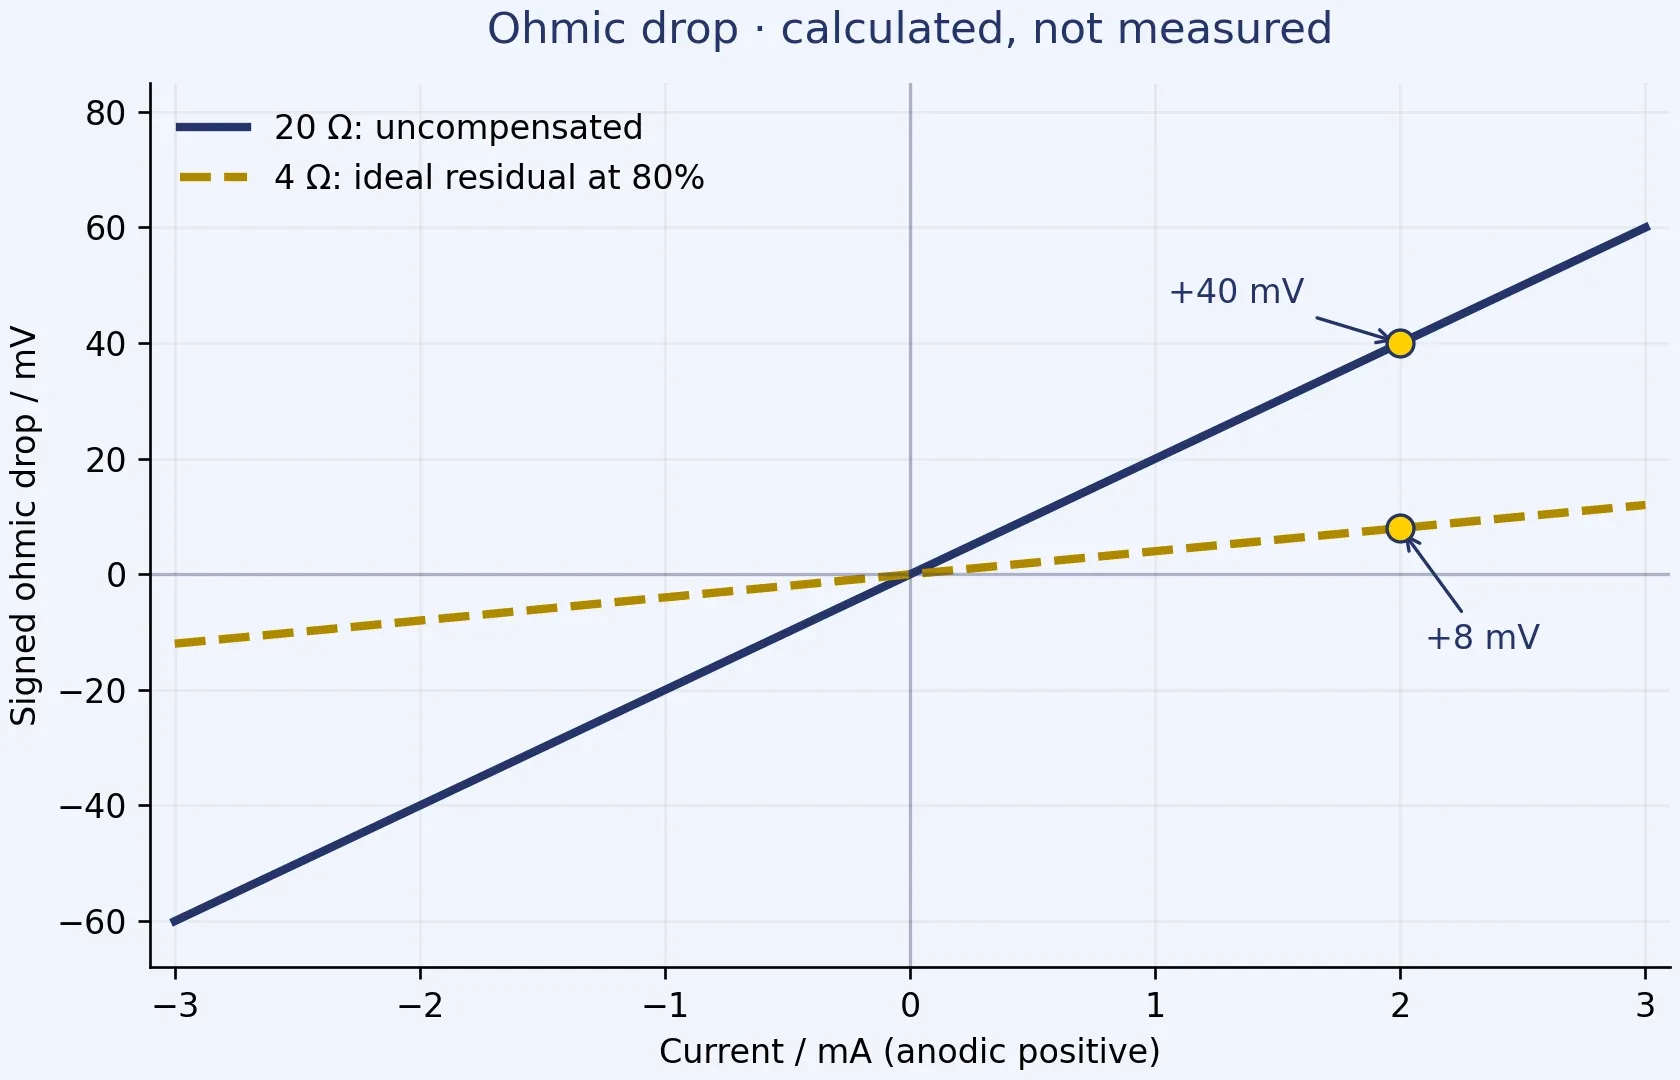
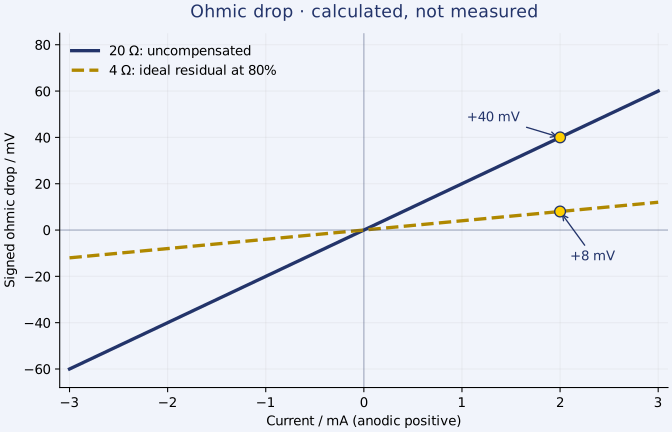
Take Rᵤ = 20 Ω and i = +2 mA, giving iRᵤ = +40 mV. If Emeasured = +0.500 V against the stated reference, the model gives a surface potential of +0.460 V.
With an equal cathodic current, i = −2 mA and iRᵤ = −40 mV. The same +0.500 V measured value now gives +0.540 V. These are separate calculations, not a claim that one cell supports both currents at the same operating point.
Idealised 80% compensation of an exactly known resistance handles 16 Ω and leaves 4 Ω. At ±2 mA, the remaining error magnitude is 8 mV. This is a teaching calculation, not a recommended instrument setting. Download the original figure as SVG.

How should resistance be estimated?
EIS can provide an appropriate series-resistance estimate through spectrum analysis or a carefully selected ZIR frequency. Current interruption estimates R ≈ ΔE/ΔI from the fast voltage change. If relaxation has already entered the first recorded point, the estimate includes more than the ohmic term. Sampling and cell time constants must therefore be considered together. BioLogic AN28: measurement methods.
With inductive high-frequency behaviour, justify the ZIR frequency using a preliminary spectrum; the highest available frequency is not automatically suitable. BioLogic AN29: battery ohmic resistance.
Original uncertainty example: an assumed resistance of 20 ± 2 Ω introduces ±4 mV uncertainty in the iR term at 2 mA. This excludes current uncertainty and other contributions. When interpreting a 5 mV difference between samples, that scale of uncertainty deserves explicit reporting.
Post-processing versus compensation during acquisition
Our suggested data-handling rule is to retain raw potential and current alongside the corrected axis. Changing a potential coordinate afterwards cannot change the potential history experienced by the sample. Do not treat the result as though a new compensated experiment had been performed.
Positive-feedback compensation can become unstable below 100%. When increasing compensation, check the step response for overshoot and ringing. Another manufacturer’s documented stability test illustrates this principle; its interface settings are not EC-Lab instructions. BASi: iR compensation and stability.
Cell properties, current range and control bandwidth jointly affect potentiostat stability. There is no compensation percentage suitable for every cell. BioLogic AN4: potentiostat stability.
Suggested verification sequence
- Define the objective: surface kinetics or complete cell voltage?
- Record reference position, wiring, temperature and cell state.
- Measure Rᵤ and retain the data supporting the estimate.
- Calculate the largest expected |iRᵤ| from the planned current.
- Compare raw signals with those recorded during a compensation trial; reduce or disable compensation if the response becomes unstable.
- Document the actual resistance, percentage, method and post-processing. Avoid subtracting the same contribution twice.
For a repeat experiment, include the resistance-measurement time in the record and state whether the same estimate was reused. Label each exported potential column so a colleague can distinguish measured, controlled and post-processed values without reconstructing the session from screenshots.
Check the specific EC-Lab capabilities together with the instrument configuration. Related methodological guides cover cyclic voltammetry and practical EIS.