An EC Labor measurement guide with manufacturer references and our own calculated example.
Potential changes; current responds
In cyclic voltammetry, potential is scanned between two switching points while current is measured. The resulting curve reflects the combined effects of the electrode reaction and mass transport.
A single curve is rarely enough
Varying scan rate can help reveal the behaviour of the system. Charge transfer, concentration conditions and mass transport all contribute to the interpretation of reversibility.
Ohmic drop, double-layer capacitance, electrode geometry and implementation of the potential programme can also affect the measurement. The BioLogic guide discusses these experimental factors and the EC-Lab CV Sim and CV Fit tools, using simulations and figures to explain the interpretation.
Worked example: four times the scan rate, twice the peak current
For a reversible solution-phase electrode reaction with semi-infinite linear diffusion at a planar electrode, the Randles–Ševčík relationship gives |iₚ| ∝ √v. Its assumptions include only one redox form initially present and negligible migration and convection. This is not a universal rule for every voltammogram. BioLogic: the relationship and its conditions.
Our calculation uses:
|iₚ| = 0.4463 nFAC √(nFvD / RT).
For our teaching example, n = 1, A = 0.0707 cm², C = 1 mmol/l = 10⁻⁶ mol/cm³, D = 7 × 10⁻⁶ cm²/s and T = 298.15 K. F ≈ 96,485 C/mol, R ≈ 8.314 J/(mol·K), and v is in V/s. Here A denotes electrode area, not amperes.
- At 25 mV/s, the calculated peak current is 7.95 µA.
- At 100 mV/s, it is 15.89 µA.
- At 400 mV/s, it is 31.78 µA.
Each fourfold increase in scan rate doubles the peak current. Enter 100 mV/s as 0.1 V/s in the equation. Entering 100 instead would inflate the result by √1000 ≈ 31.6: unit conversion alone can invalidate the analysis.
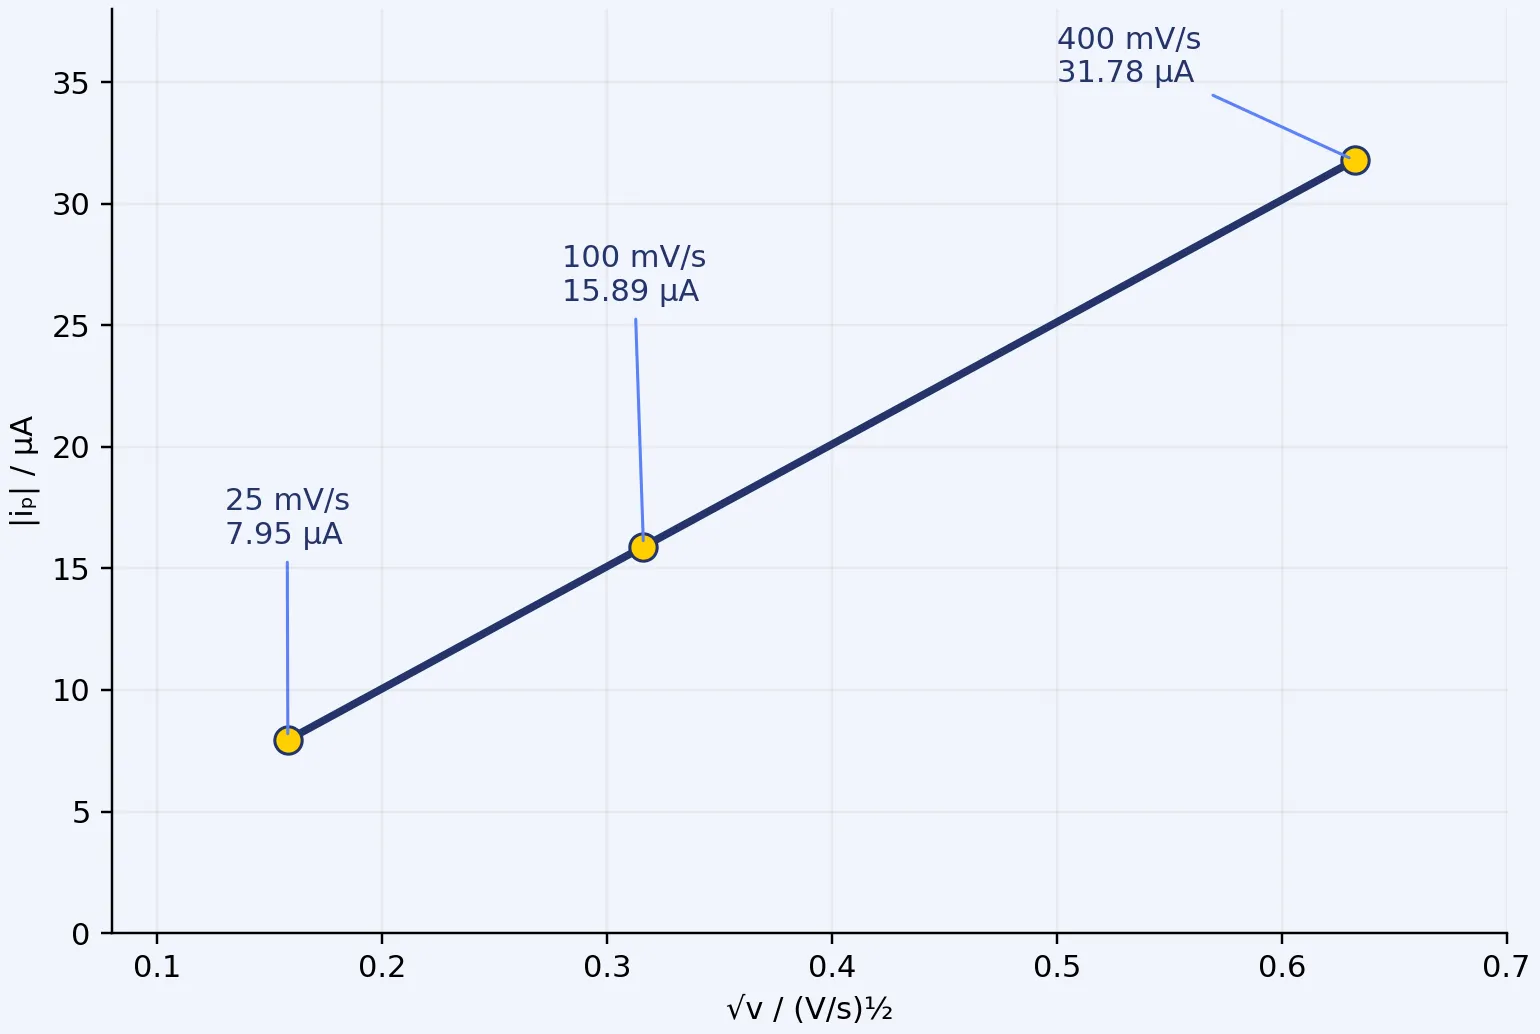
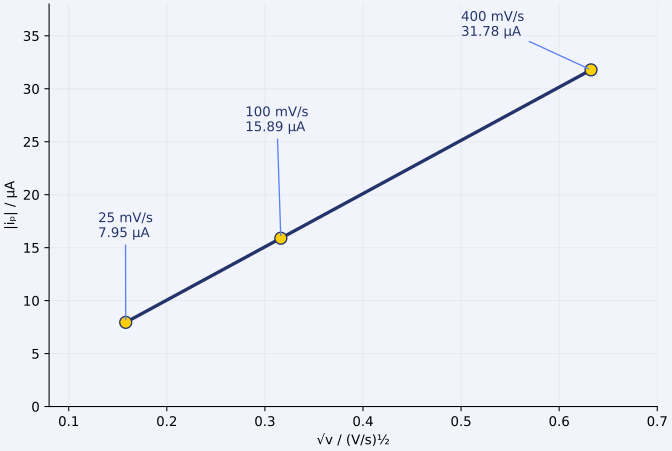
This plot compares peak currents; it is not a current–potential voltammogram. For measured data, document baseline selection and the peak-finding method. An approximately straight |iₚ|–√v plot alone does not establish a unique mechanism.
Ohmic drop can shift peaks too
The iR drop across uncompensated resistance in the electrolyte and measurement arrangement can make the applied potential differ from the potential at the electrode surface. It can change both peak positions and currents. Increased peak separation therefore does not automatically establish slower electron transfer. BioLogic AN27: effects of ohmic drop.
Our magnitude estimate: 100 µA multiplied by 200 Ω gives 20 mV. Compare this with the potential shift you intend to interpret. Record how resistance was determined and what compensation was applied; retain raw curves alongside corrected data.
Plan time and sampling first
Scanning from −0.2 V to +0.6 V and back at 0.1 V/s covers a total potential path of 1.6 V, so one cycle takes 16 seconds. Five cycles take 80 seconds, excluding separate waiting periods. These are calculation examples, not recommended potential limits for an unknown sample.
Recording a point every 1 mV along that ramp corresponds to 0.001/0.1 = 0.01 s, or 10 ms. This describes recorded point density; it does not specify the instrument’s internal control rate.
What should the measurement record contain?
An editorial checklist for comparable experiments:
- Working-electrode material, area and preparation; reference and counter electrodes.
- Solvent, electrolyte, concentration, temperature and solution pretreatment.
- Initial and switching potentials, named reference and initial scan direction.
- Scan rates, cycle count, waiting times, recording settings and current range.
- Uncompensated resistance, compensation, blank measurement and baseline treatment.
- The analysed cycle, peak-selection method and repeatability.
From the curve to the configuration
Alongside EC-Lab, our reference-electrode overview and EIS guide support measurement planning.
The SP-50e and SP-150e are starting points for comparison. In the instrument finder, specify cell configuration, current and potential window; add scan rate and the smallest expected signal in the notes. Confirm the final configuration against the complete experiment.
Our iR compensation guide explains how to assess uncompensated resistance and check the correction.