Reading charge and discharge curves
The original article is based on BioLogic’s guide to cycling curves. Electrochemical experiments reveal both battery behaviour and the reactions underlying it. One direct approach records voltage and charge throughout successive charge/discharge cycles. Changing C-rate can form part of a rate-capability study; ageing comparisons require consistent protocols.
Cycling data yield capacity and coulombic efficiency. Polarisation, hysteresis and overpotential provide further evidence of changes in cell behaviour. Several complementary representations can be produced from the same dataset.
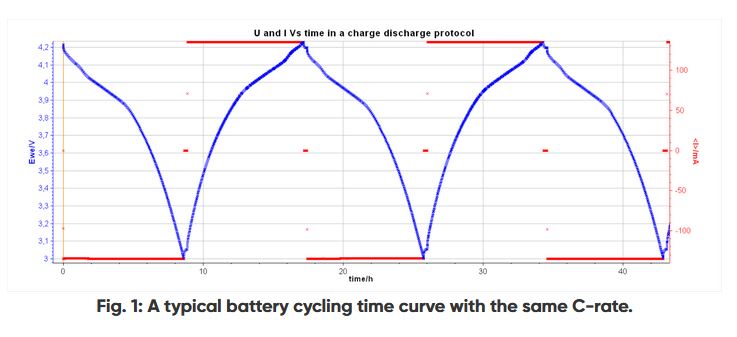
Voltage and current against time show limits, steps and cycle duration. At the same constant current magnitude, consistently defined shorter discharge periods mean less recovered charge. A sudden voltage change warrants investigation but does not independently prove an internal short circuit.
Capacity and efficiency can be plotted against cycle number to investigate ageing. Alternatively, isolate a cycle for closer examination of insertion behaviour.
Material characterisation through differential capacity
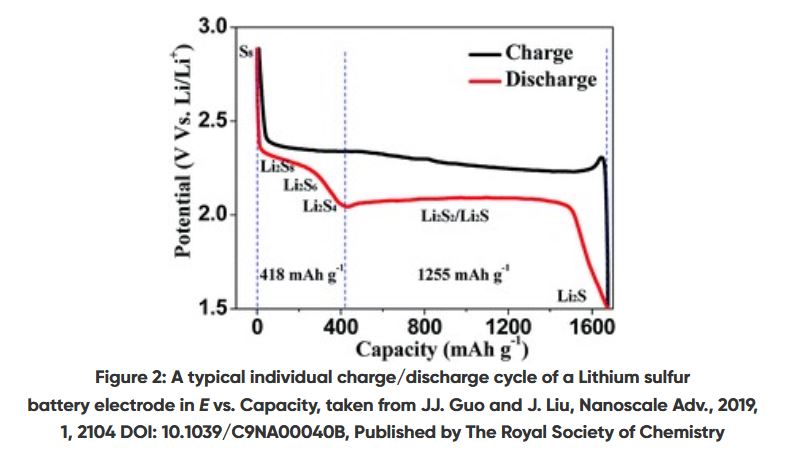
Voltage against capacity for an individual cycle provides a useful starting point.
Plateaus in voltage–charge curves may appear as peaks in dQ/dE against E. Changes in peak position, height, width and area help follow structural changes. Both electrodes contribute to a full-cell curve; assigning peaks requires further information or reference-electrode measurements. Charge/discharge differences also provide evidence relevant to reversibility.
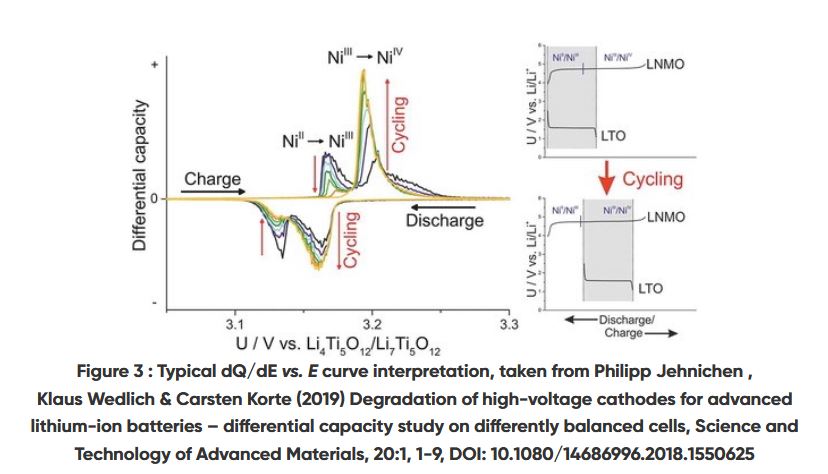
Our lithium-ion testing article discusses DCA and related methods.
Another representation plots voltage against current or C-rate to examine polarisation. Output current affects losses, terminal voltage, delivered charge and energy. The area under a discharge voltage–charge curve represents energy; the area under voltage against time alone does not. A protocol containing different C-rates can provide potentials at matched states of charge for constructing polarisation curves.
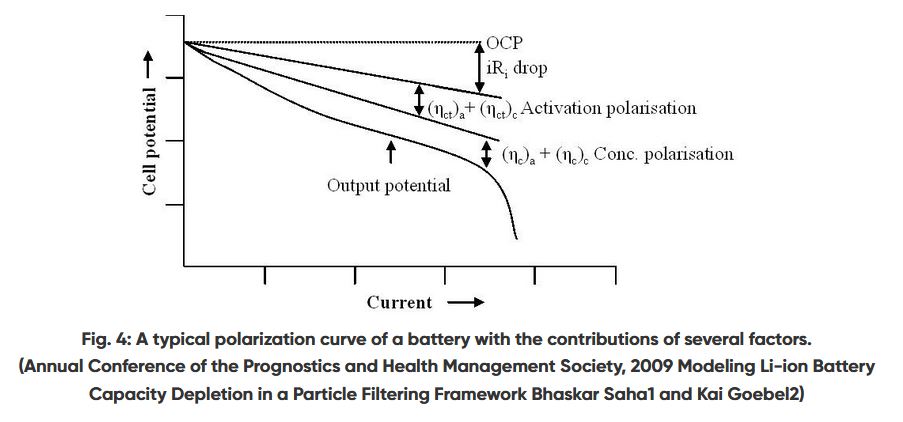
Contributions to the voltage departure include:
- Ohmic drop: the contribution associated with current flowing through resistive parts of the cell and connections.
- Activation polarisation: additional voltage associated with finite electrode-reaction rates.
- Concentration polarisation: the contribution of mass transport and concentration differences.
Performance studies
Relevant measures depend on the application. Specific energy and specific power express energy and power per mass, while volumetric energy density uses volume. These quantities can be calculated from cycling results when the mass or volume basis is defined.
Cycle life is the cycle count reached at a specified endpoint under a defined protocol. The endpoint may be a chosen fraction of initial capacity; report the criterion rather than assuming one threshold applies everywhere.
Capacity retention and coulombic efficiency (CE) are distinct. Retention is the discharge capacity under the protocol divided by its initial value. CE = Qdischarge/Qcharge for paired charge and discharge sections, with the cycle convention stated. CE does not independently measure total capacity loss. Current, temperature and protocol can influence both quantities.
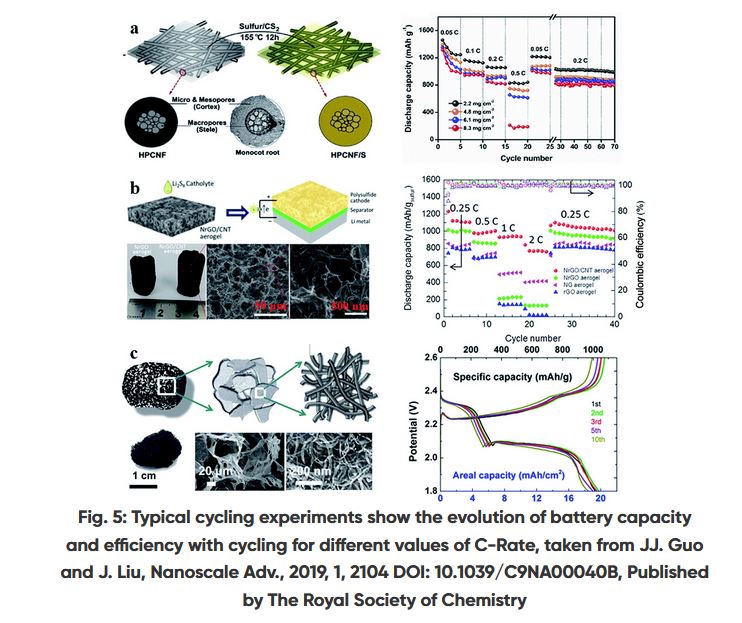
Even DC cycling supplies several useful views of electrochemical behaviour. Clear extraction and presentation make that information usable. Different C-rates, OCV rests and pulses can extend a cycling protocol, but should be planned because testing itself can change the cell.
Application profiles introduce partial charging and discharging, power peaks and varied rest times. They complement conventional cycling by representing the demands of a particular use case.

Related topics include high-precision coulometry, coulombic efficiency, cycle life, parasitic reactions and activation or concentration polarisation. Suitable instruments include battery cyclers and potentiostats; the required current, voltage, channels and optional techniques determine the configuration.
Worked example: two different ratios
Our illustrative values are an initial discharge capacity of 2.00 Ah, then 1.82 Ah charged and 1.80 Ah discharged in a later cycle. Capacity retention is 1.80/2.00 = 90%, while that later cycle’s CE is 1.80/1.82 = 98.90%. The numbers answer different questions; neither independently determines remaining lifetime.
See the DCA guide and battery-cycler guide for processing details. The instrument catalogue provides current models.