Why extend battery testing with impedance?
Batteries power tools, lawnmowers, portable equipment and electric vehicles. Variable loads and industrial storage applications can require more detailed characterisation than a single capacity test. Manufacturers and users both need evidence of quality before and after cells enter a product.
This article retains a 2019 introduction to BioLogic battery-test workstations. Its BCS-8xx hardware and software illustrations are historical examples; use the current catalogue for present configurations.
What should a test establish?
A test may support a pass/fail decision or investigate processes associated with failure. Impedance helps diagnosis, but a full-cell spectrum does not necessarily separate cathode, anode, electrolyte and separator contributions uniquely.
Electrochemical impedance spectroscopy (EIS) applies a small AC perturbation around an operating point and measures the response over frequency. It supports studies of polarisation, ageing and state changes. Estimating state of charge (SoC) or lifetime requires a calibrated model validated against independent data; there is no direct conversion valid for every chemistry.
These data can support battery-management-system (BMS) development and quality control. The protocol must represent the application. Read our EIS introduction for the underlying measurement principles.
What can DC cycling tell us?
Voltage, current and time from cycling provide charge, energy and other quantities. For an operating battery, U(t)/I is not its internal resistance, because terminal voltage includes the equilibrium cell voltage.
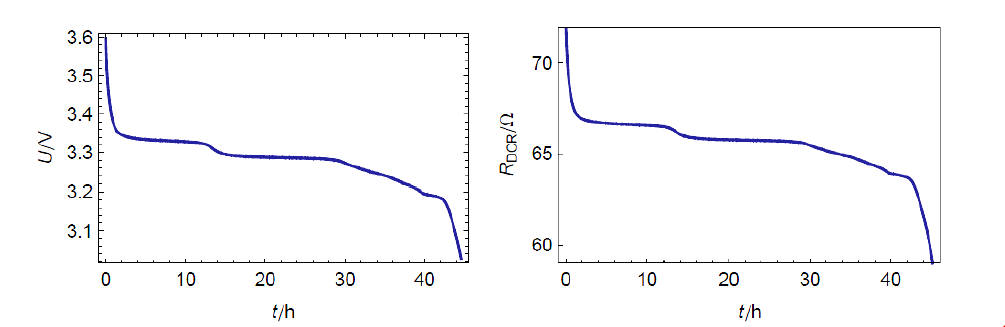
Original illustration of a Li-ion discharge at 50 mA and a voltage/current ratio. Its ratio plot should not be interpreted as DCIR.
For a current step, with positive discharge current, use RΔt = [Ubefore − Uafter,Δt]/[Iafter − Ibefore] and report the evaluation time and current step. The retained historical image does not override this distinction. See the DC/AC internal-resistance guide.
Impedance measurements
EIS can be performed at open circuit or under a DC operating condition. Galvanostatic operation is useful in many battery experiments; the appropriate control mode and perturbation require consideration of the cell and instrument.
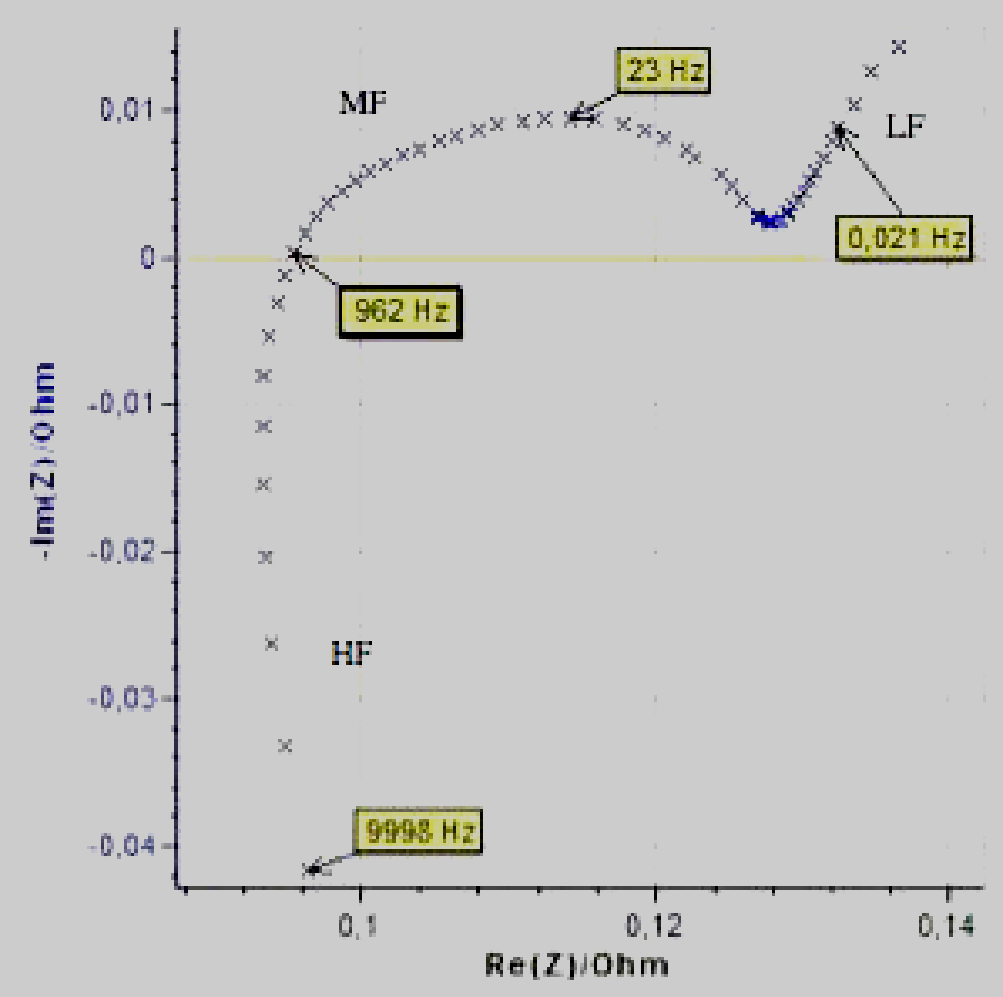
Low-, middle- and high-frequency regions correspond to different timescales. Processes may overlap, and cables or contacts can contribute. Frequency alone does not uniquely identify a physical mechanism.
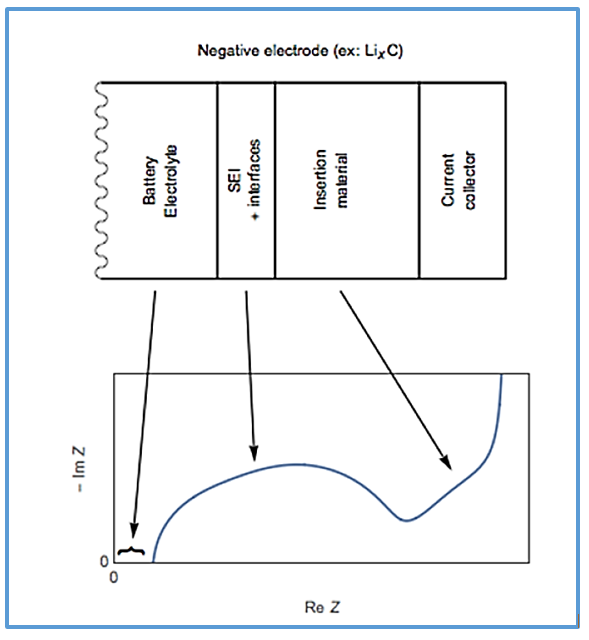
The retained LiₓC illustration concerns lithiated carbon, typically a negative-electrode material rather than a generic cathode. Assignments to ohmic, interfacial and slower transport contributions require evidence for the actual system.
A historical fitting example
Equivalent-circuit fitting requires a model, starting values and meaningful bounds. The software estimates parameters; a close fit does not automatically establish the physical model.
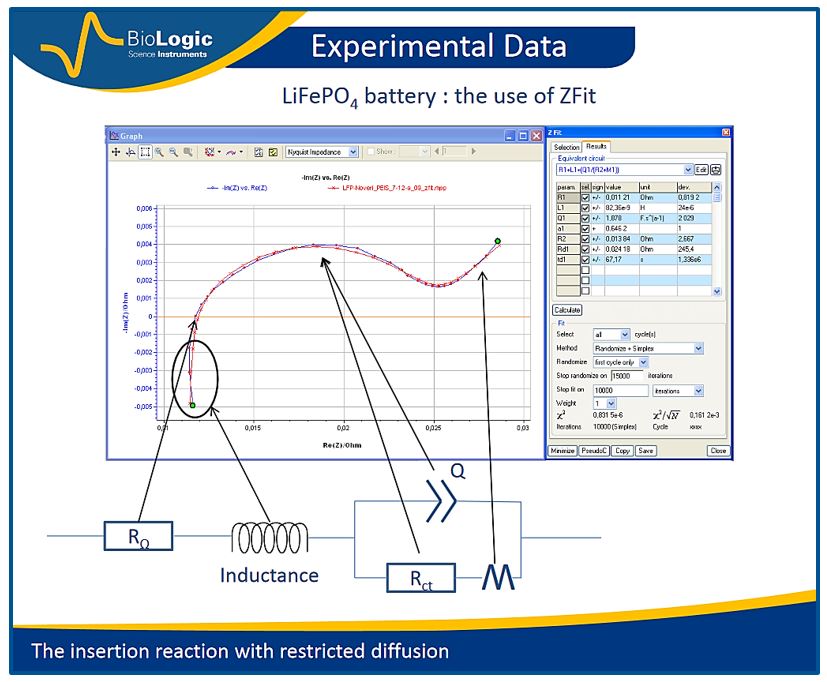
In the original figure, blue points represent measured data and red points the calculated response. The circuit beneath the plot defines the mathematical model. Parameters are adjusted to reduce the discrepancy between model and measurements. Physical assignments to electrodes, electrolyte or interfaces must be justified separately.
Spectra can change with SoC, operating conditions or ageing. The following retained figures compare states of charge.
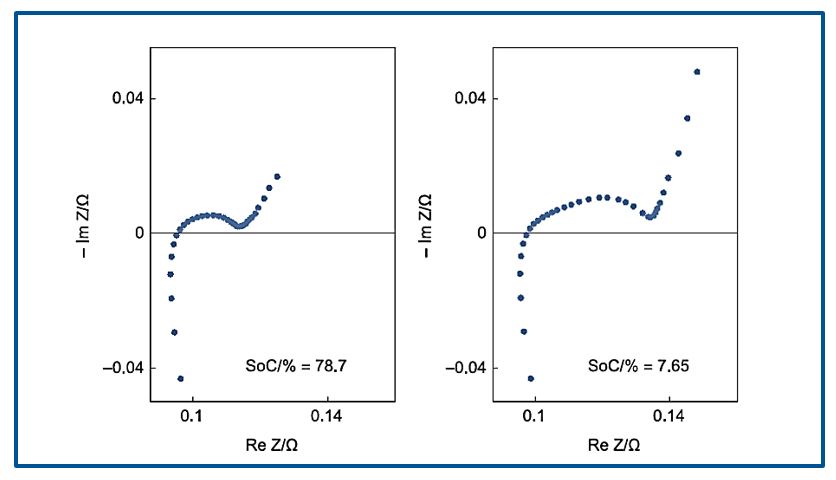
Plotting impedance modulus against frequency provides another view of the same differences; it can complement the Nyquist representation rather than replace it.
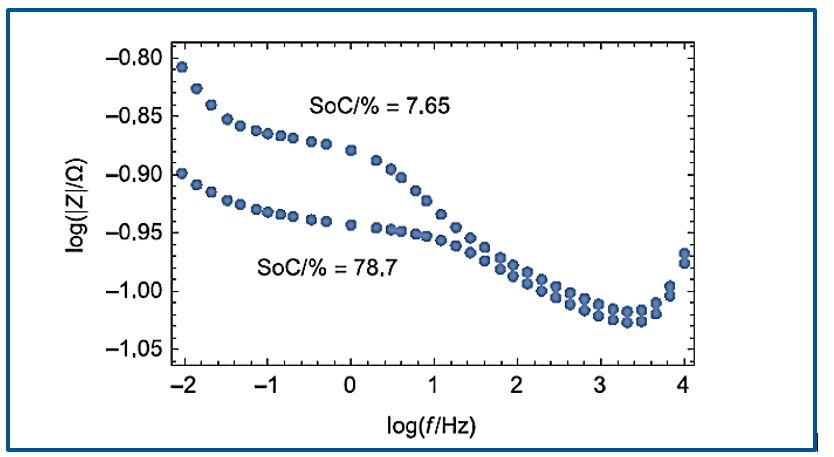
The original example shows a relationship between low-frequency |Z| and SoC. Such a relationship may support an empirical estimator after calibration for the chemistry and conditions. Temperature, ageing and prior history can change it, so validation must cover the intended range of use.
Similarly, trends in circuit parameters can support ageing studies. Predicting SoH or remaining lifetime requires long-term comparison data and validation. One fitted parameter does not establish a reliable life prediction.
Workstations and practical follow-up
Combining cycling and impedance data characterises a cell from several perspectives. Conclusions must remain within the methods’ limits.
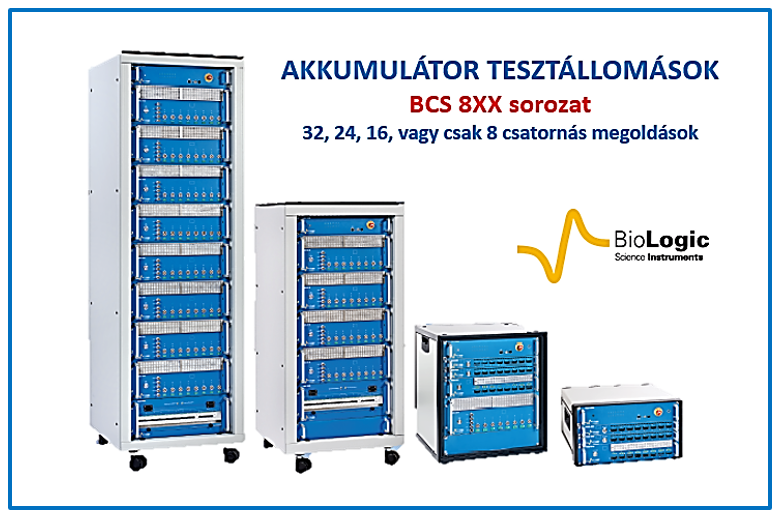
The BCS-8xx and BT-Lab/ModuloBat workflow shown here belong to the original historical example. Modular systems can be configured for different tasks, but current models, options and independent channel capabilities should be checked in their own specifications.
For a new experiment, prepare the cell-voltage window, current range, required channels and impedance-frequency range. The instrument finder helps narrow candidates; contact the Hungarian representative to review the protocol.
Original article: Dr. István Kovács, Labornite Kft. Scientific additions and corrections are identified by the editorial notice on this page.