An EC Labor measurement guide with manufacturer references and our own calculated example.
Three indicators, three different questions
A smooth Nyquist curve does not establish measurement validity. EC-Lab quality indicators examine different parts of the response:
- THD — Total Harmonic Distortion: relative contributions at integer multiples of the fundamental frequency; supports linearity assessment.
- NSD — Non-Stationary Distortion: sensitive to settling and time variation.
- NSR — Noise-to-Signal Ratio: noise relative to signal, excluding frequencies assigned to THD and NSD.
Current and voltage indicators matter separately. BioLogic AN64: indicator definitions.
Calculate a THD value
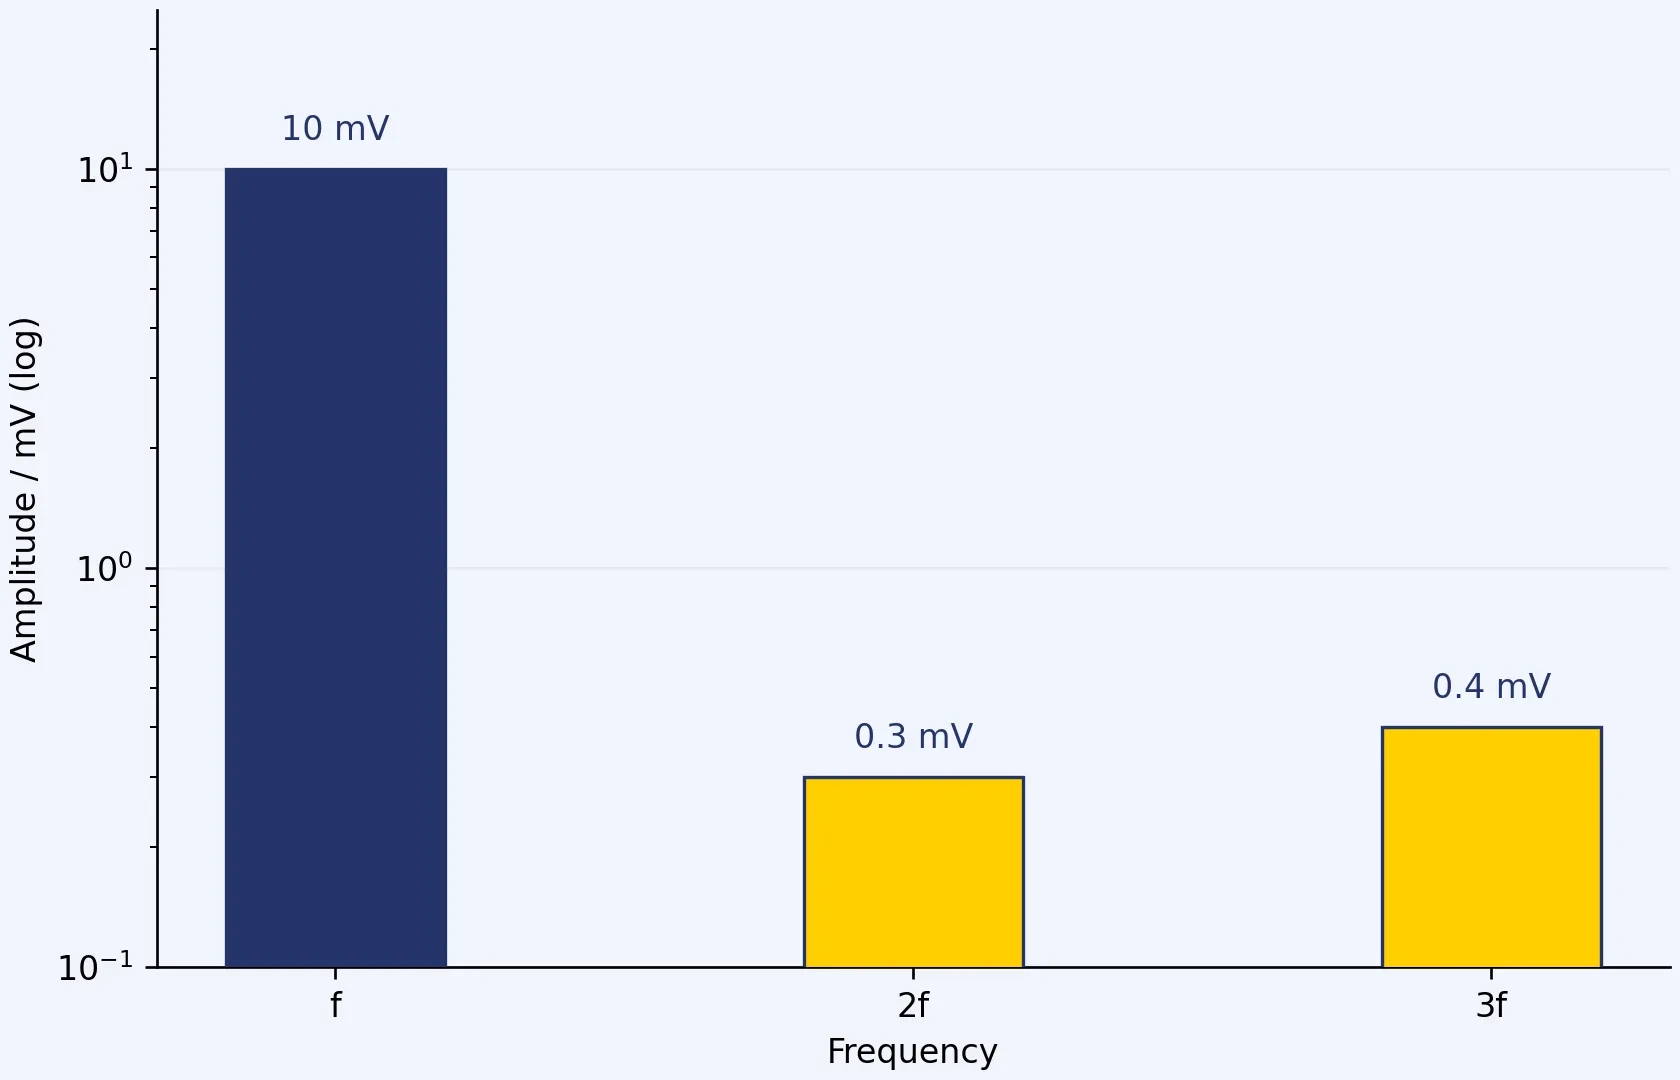
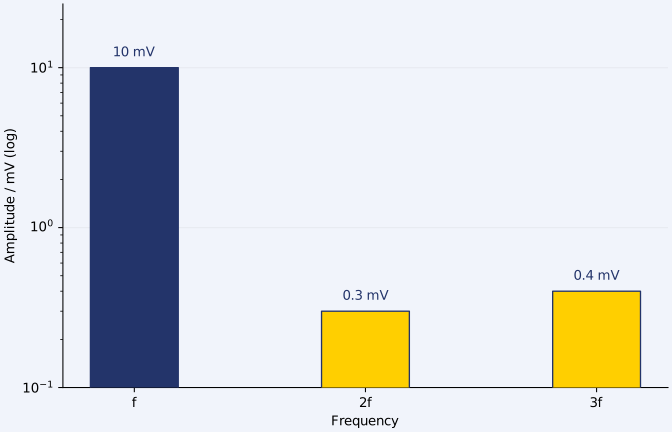
Our teaching example uses a synthetic voltage signal with a fundamental amplitude of 10 mV. Its second harmonic is 0.3 mV and its third harmonic 0.4 mV; higher harmonics are zero. All components use the same amplitude convention.
The root sum of squares of the harmonic amplitudes is:
√(0.3² + 0.4²) = 0.5 mV.
Relative to the fundamental, this gives 100 × 0.5 / 10 = 5% THD. Simply adding the harmonics is incorrect: using 0.3 + 0.4 = 0.7 mV would give an erroneous 7%.
The cover figure shows this synthetic spectrum on a logarithmic amplitude axis. Frequencies are f, 2f and 3f; these are not instrument measurements. Here, 10 mV is the fundamental amplitude of the analysed response, not a recommended excitation setting. THD equation: AN64.
Doubling all three amplitudes leaves the ratio at 5%. This follows from normalisation; it does not predict that a real cell will behave this way when excitation is increased.
Why 5% is not a universal acceptance limit
BioLogic discusses 5% as a practical guideline; acceptability depends on the system and frequency. Lower excitation can support linear behaviour while worsening signal-to-noise ratio. Examine THD, NSD and NSR together across frequency. Manufacturer guide to reliable EIS.
Our editorial conclusion: having all indicators below 5% does not establish correct cell wiring, adequate instrument accuracy at the relevant impedance, or a suitable physical fitting model. Data quality and model interpretation need separate assessment.
Why does low-frequency measurement time matter?
NSD can rise while a sample is settling or while its properties continue to change. Repeated spectra and the measured time trace can help distinguish these situations. Assess drift correction against the actual type of variation. BioLogic: EIS on time-varying systems.
Our timescale example: at 10 mHz, one period takes 100 s and three take 300 s. If DC potential changes at 0.02 mV/s throughout, the total shift is 6 mV. This is not an NSD calculation: the indicator uses spectral components. It illustrates why the operating point should also be followed during a long measurement.
A suggested checking sequence
This is an editorial workflow; adapt actual settings to the sample.
- Record the initial conditions. Cell, electrodes, temperature, DC operating point, current and voltage ranges, software version.
- Inspect the time trace. Record waiting time and how much the sample changes during the spectrum.
- Compare excitation amplitudes. Keep other conditions fixed and check whether the sample changed between repeats.
- Examine indicators alongside the spectrum. Identify affected frequencies rather than saving only an average.
- Repeat after a justified change. Make the intervention and outcome traceable.
- Then fit the data. Document excluded points and reasons; retain the original data.
What should you prepare for technical support?
Alongside the raw measurement file, prepare DC time traces, THD/NSD/NSR curves, settings and a description of cell wiring. Explain what happens at which frequency, what you changed and what happened afterwards.
Our EIS introduction supports spectrum interpretation, and the EC-Lab page introduces the software workflow. Discuss instrument and configuration questions with the Hungarian representative. Original manufacturer notes are available through the document library.
For analysing checked data, our EIS fitting guide discusses model selection and validation.