

An EC Labor measurement guide with manufacturer references and our own calculated example.
The method is part of the result
Battery behaviour includes ohmic, capacitive and inductive effects. A value reported as internal resistance should therefore be interpreted together with the measurement method.
A DC measurement calculates resistance from the voltage response to a change in current. The chosen evaluation time affects which processes contribute to the result. A single-frequency AC measurement enables rapid comparisons, while EIS describes the cell response over a range of frequencies. BioLogic AN38: comparing DC and EIS.
Comparing measurements
Values obtained with different methods should not automatically be treated as the same quantity. Consistent measurement protocols are needed for comparison. The manufacturer article explains DC and AC methods, Nyquist plots and the importance of frequency selection. BioLogic: internal resistance, Part II.
One cell model, three different numbers
Our teaching example connects a constant 3.700 V source to a 10 mΩ series resistance and a parallel RC element. The RC resistance is 20 mΩ and its capacitance is 50 F, giving τ = RC = 1 s. This model excludes inductance, diffusion, temperature changes and state-of-charge-dependent equilibrium voltage; it is not a fit to a particular battery.
Initially the RC element is relaxed. Discharge current steps from 0 to 1 A, with discharge defined as positive. After the step:
U(t) = 3.700 V − 1 A × [0.010 Ω + 0.020 Ω × (1 − exp(−t / 1 s))].
With this convention, apparent resistance is R(t) = [U(0−) − U(t)] / ΔI. The ideal value immediately after the step is 10 mΩ. At one second, terminal voltage is 3.67736 V and resistance is 22.64 mΩ; at ten seconds, these become 3.67000 V and approximately 30.00 mΩ. The same unchanged model therefore produces three results depending on evaluation time.
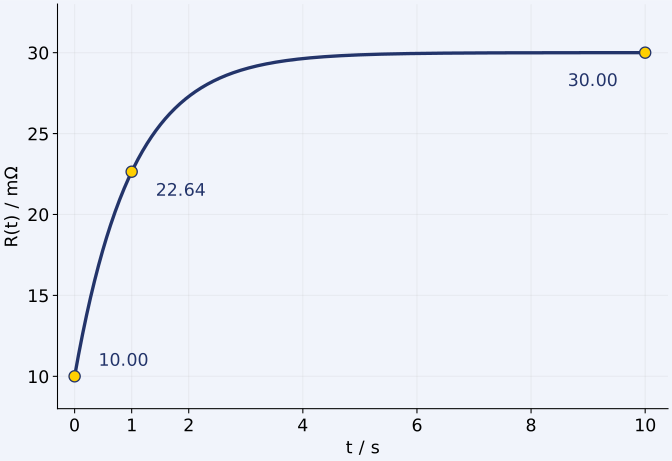
Original calculated illustration, not measured data. The example current is not a general measurement recommendation.
Why is the 1 kHz value different?
The same ideal circuit has impedance Z(ω) = 0.010 + 0.020 / (1 + jω × 1 s) Ω, where ω = 2πf. At 1 kHz its modulus is approximately 10.000001 mΩ, with a phase of −0.018°. This does not make the one-second DC result incorrect: it describes a different response.
Another purely numerical example: if Z = 10 − j10 mΩ at one frequency, its real part is 10 mΩ but its modulus is √(10² + 10²) = 14.14 mΩ. A field labelled “resistance” alone is insufficient to establish which quantity an instrument reports.
BioLogic ACIR operates at one frequency, in galvanostatic or potentiostatic mode. DCIR is also available in EC-Lab and BT-Lab. BioLogic: techniques and software processing.
When is a full spectrum useful?
When investigating why cell behaviour changed, a single resistance number may provide limited evidence. BioLogic AN38 compares DC and EIS results, treating dynamic resistance as an approximation to the information obtained in the frequency domain. BioLogic AN38.
Our example shows that simply relabelling a DC evaluation time as a frequency does not make the quantities identical. Report the model when quoting a resistance fitted from a spectrum. A close fit alone does not establish a unique physical interpretation.
What should the measurement record contain?
Our suggested checklist for traceable comparisons:
- State: cell identifier, preceding cycle, how state of charge was determined, temperature and rest period.
- DC settings: initial and final current, pulse duration, evaluation time, sampling and sign convention.
- AC settings: frequency or range, excitation amplitude and its definition, DC operating point.
- Connections: voltage-sensing position, holder, cables and connection repeatability.
- Result: R(t), real part, modulus or fitted parameter; units, repeats and spread.
If the holder changed between test series, mark that on the graph. Retain the complete time trace for an outlier: the final resistance value does not show how the voltage drop developed.
Start with channel count, current and EIS requirements in the instrument finder. Our EIS introduction and data-quality guide support measurement planning; contact the local representative to discuss a configuration.
For cycling protocols and capacity measurement, read our battery-cycler guide.