
An EC Labor measurement guide with manufacturer references and our own calculated example.
From carbon dioxide to chemical products
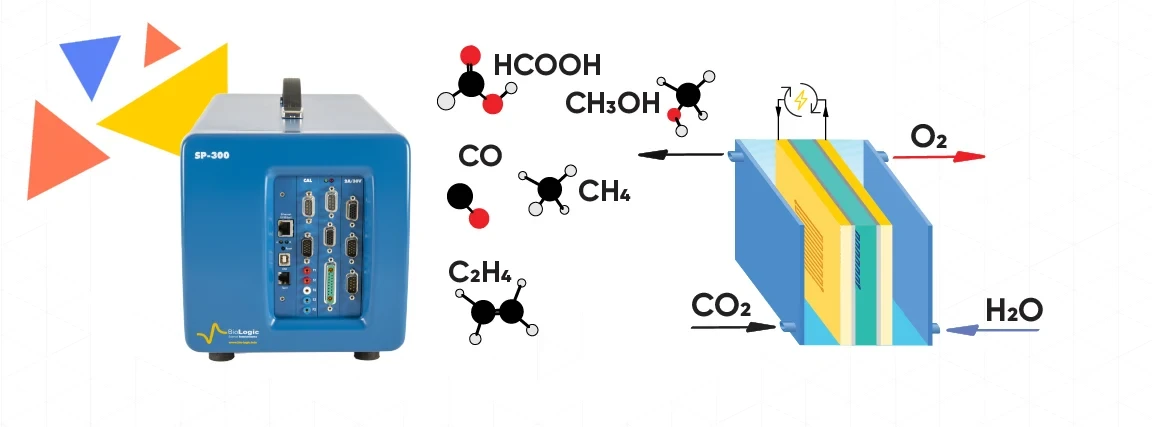
Electrochemical CO₂ reduction uses electrical energy to convert carbon dioxide. Products depend jointly on the catalyst, electrode, cell design and operating conditions.
Research uses H-cells, gas-diffusion electrodes and membrane–electrode assemblies. These approaches create different reaction and mass-transport environments.
What should be considered together?
Selectivity, energy demand and long-term stability all matter. Interpreting an electrochemical result also requires product identification and quantification. The manufacturer overview connects reactions, possible products and technological challenges.
Our original CO-production example below connects charge, product quantity and energy consumption. Its numbers are illustrative, not measured catalyst results.
Faradaic efficiency: where did the charge go?
A product’s Faradaic efficiency is FE = zFn/Q, multiplied by 100 for percent. Here n is product amount, z is the electron count per product molecule, F ≈ 96,485 C/mol, and Q is the magnitude of charge transferred during the interval. Current and product analysis must cover the same interval. Methods background: reliable Faradaic-efficiency reporting.
For CO production, z = 2: two electrons are required per molecule.
Take a constant current magnitude of 100 mA, an electrolysis duration of 3600 s and a total quantified CO amount of 1.40 mmol:
- Charge: Q = 0.100 A × 3600 s = 360 C.
- Charge assigned to CO: 2 × 96,485 × 0.00140 ≈ 270.2 C.
- CO Faradaic efficiency: 270.2/360 × 100 ≈ 75.0%.
- Average CO partial current: 270.2 C/3600 s ≈ 75.0 mA.
The remaining approximately 25% cannot automatically be assigned to hydrogen. H₂ must be quantified too; other products or incomplete measurement can contribute to the balance. For time-varying current, Q = ∫ |I(t)| dt over an exclusively cathodic interval, not an arbitrarily selected current multiplied by duration. Evaluate current reversals separately.
Sampling is part of the measurement
For gas products, concentration must be accompanied by the actual outlet flow rate. Inlet CO₂ flow need not equal outlet gas flow: CO₂ consumption and formation of other gases can change it. Coordinate composition and flow measurements using appropriate calibration. Experimental guide to operating CO₂ electrolyzers.
Our error example: if actual outlet flow is 8 ml/min but the calculation uses 10 ml/min, unchanged product fraction and gas conditions give a 25% overestimate of production rate. A true FE of 60% would appear to be 75%. Record the temperature, pressure and dry/wet gas basis associated with the flow rate.
Products may cross a membrane or be consumed at the counter electrode. Incomplete coverage of phases and sampling points can lower the measured total FE; totals above 100% also need investigation. Sampling errors and product losses.
As editorial guidance, save each analytical method’s calibration, blank, detection limit and sampling times. “Not detected” is not equivalent to zero production.
Selectivity, productivity and energy
With a geometric electrode area of 2.0 cm², our example gives a total current density of 50 mA/cm² and CO partial current density of 37.5 mA/cm². At equal FE, higher current can mean higher production; FE itself is not a production rate. Always identify the area definition.
At a constant full-cell voltage of 3.0 V, electrical energy consumed during the hour is UQ = 1080 J, or 0.300 Wh. Per amount of CO, this is 0.214 Wh/mmol, approximately 771 kJ/mol. It covers only electrical input to the cell, excluding pumping, gas preparation and product separation. Do not substitute cathode potential versus a reference electrode for full-cell voltage.
Single-pass CO₂ conversion and FE are different metrics. Product-stream composition and carbon transported toward the anode also matter when evaluating the process. Research analysis: conversion and outlet composition.
What belongs in the measurement plan?
This editorial checklist provides a starting point:
- Catalyst, support, loading, geometric area and pretreatment.
- Cell, membrane, electrolyte, temperature and gas supply.
- Current or potential control, reference electrode, full-cell voltage and charge.
- Synchronised gas/liquid analysis, flow and sampling delay.
- Product-specific FE, partial current density, energy input and time evolution.
- Repeats, uncertainty, omitted intervals and carbon-balance boundaries.
Stable current alone does not demonstrate stable selectivity: plan product analysis throughout durability testing. Summarise requirements in the instrument finder, including full-cell voltage, required current and channel count. Our EIS data-quality guide provides related measurement guidance.